
Honest numbers
Every performance number we publish is measured on the shipped binary, stamped with version and hardware, and reproducible from the repo. Here's what we measure, how, and the rule we won't break.
A control plane lives in your request path. So the first question anyone should ask is: what does it cost to pass through? I want to answer that the same way every time, with numbers you can reproduce, not adjectives. This post is about how we measure, and the one rule we hold to.
The rule: no number we can’t reproduce
Every performance fact on this site carries three things: what version it was measured on, what hardware, and how. If a number can’t be stamped with all three, it doesn’t ship. That’s not a slogan. It’s enforced. The site’s facts live in one file with a self-check that fails the build if any measurement is missing its source, version, or hardware. A page cannot quote a latency figure that isn’t traceable to a run.
There is exactly one canonical value for each thing we measure. The added-latency number the homepage shows is the same object the performance page shows, which is the same object the docs show. They can’t drift, because they’re the same variable. When we re-benchmark, the number changes in one place and everywhere at once.
Two of those numbers are easy to conflate, so we keep them strictly apart. Added latency is the end-to-end, wall-clock cost a calling app actually experiences (through-gateway minus direct-to-upstream), measured identically for every gateway; busbar’s is about 70 µs p99 (busbar 1.5.0, onthebench field). Per-request processing time is a different thing: just the CPU busbar itself burns per request (Server-Timing: busbar;dur), about 33 µs p99 (busbar 1.5.1, c7g.8xlarge scaling run, measured 2026-08-03). The processing time is one slice of the added latency, not the added latency itself, so we never call it “latency” and never rank gateways by it.
What we measure, and the honest version of each
Per-request processing time, busbar’s own CPU cost. This is the CPU time Busbar itself spends: parse the request, translate the protocol, serialize the response. Not the network, not the model. We expose it per-request as a Server-Timing: busbar;dur span, so you can read it on your own traffic, and we measure it the same way. It’s a compute/efficiency stat, not a latency one. On a 16-core Graviton3 pin, a same-protocol small request costs p50 21 µs, p99 33 µs of CPU (busbar 1.5.1, c7g.8xlarge, measured 2026-08-03). The honest caveat is right next to it: a cross-protocol translation of a ~12k-token body is our worst published case at p50 84 µs, p99 158 µs (same run). Bigger bodies cost more to re-serialize, and we publish the expensive case, not just the flattering one.
In-process handling latency. Separately, the busbar crate has a release-build test that runs 50,000 requests against an instant mock and records the handling distribution: p50 31.5 µs, p90 37.79 µs, p99 52.29 µs (busbar 1.4.1, capture_latency_metrics release build, Apple Silicon, measured 2026-07-31). Note the version. That is a real measurement, but it is an older release than the current 1.5.3, and we would rather say so than round it up to today. This suite is captured by hand from the busbar repo, so unlike the image and binary sizes it does not refresh when a new release ships; it keeps the version of the run that produced it until it is re-run. The 1.5.3 changelog records no change to the request hot path, so we expect it still to hold, but expecting is not measuring and we will not restate it as a 1.5.3 figure until the test runs on 1.5.3. This is enforced rather than promised: the build fails if these values ever appear in the site’s fact file without their own version, date and source, so they can never quietly inherit the current release’s stamp again. It’s a regression metric: if a change makes the hot path slower, that test moves, and we see it before you do.
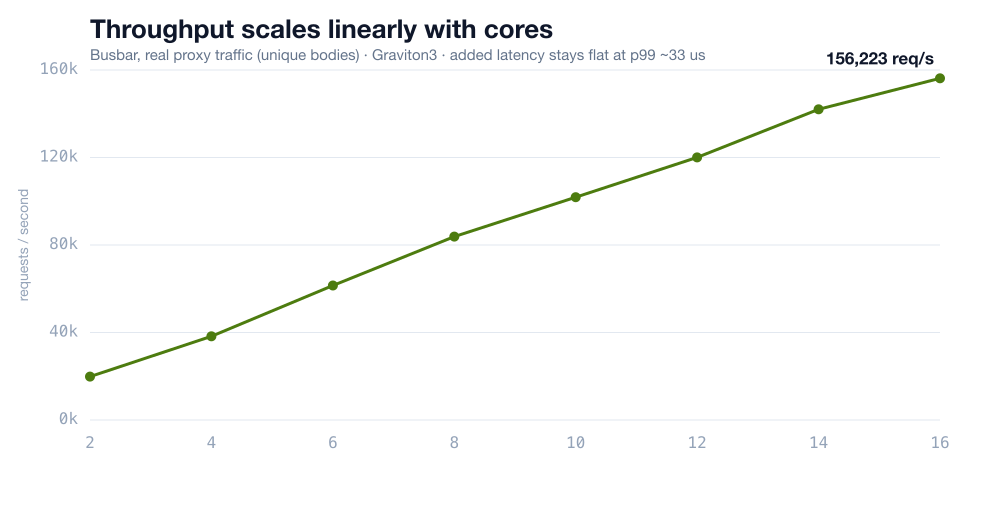
Throughput, and how it scales. On the same Graviton3 box, swept from 2 to 16 pinned cores with unique request bodies (so every request is real proxy work, not a cache hit), Busbar goes from ~19,800 req/s on 2 cores to ~156,000 req/s on 16, close to linear, roughly 9,750 req/s per core. And the per-request processing time (busbar;dur) stays flat across the whole sweep: p99 sits at 32–37 µs whether you’re on 2 cores or 16. Scaling out doesn’t cost you per-request CPU. (Those are the v1.4.x figures this post was written against. The current sweep, measured with a Rust mock that never caps the gateway, is dead linear to ~209,214 req/s on 16 cores, ~13,076 req/s/core (busbar 1.5.1, c7g.8xlarge, measured 2026-08-03); see the performance page for the live numbers.)
Memory. Idle resident set is about 7.79 MiB (busbar 1.5.0, onthebench field, measured 2026-08-03). Under the current 1.5.1 throughput sweep the working set sits between ~58 and ~99 MB (c7g.8xlarge, measured 2026-08-03). Under a deliberately hostile soak (150 KB payloads, sustained) it plateaus at a bounded working set and falls back to ~252 MB within about 30 seconds of the load ending (busbar 1.4.1, memory-soak run, measured 2026-07-19, an older build than the throughput and latency numbers above), instead of holding a high-water mark. Bounded, and it gives memory back.
Footprint. The Docker image is a FROM scratch container: the static binary plus the provider catalog, 5.74 MB compressed. The raw binary is 10.89 MB (busbar 1.5.3, current release). No runtime, no interpreter, no sidecar in the request path.
Why “measured on the shipped binary” matters
It’s easy to publish a benchmark of a build that isn’t what you ship. So the numbers above come from the release artifact, and the three that can be are auto-measured from the actual Docker image and binary on every refresh (image size, binary size, idle memory) rather than typed in by hand. The added-latency and scaling runs are stamped with the exact hardware (c7g.8xlarge, 32 vCPU Graviton3, 16-core pin, us-east-1) and the version they ran on; the in-process handling test above is stamped with its own, different, run. When you read a number, you can see what produced it.
That’s also why you won’t find a single round, decorative figure here. “Microsecond overhead” is a category, not a measurement. The measurement is 21 microseconds at p50, 33 at p99 (busbar 1.5.1, c7g.8xlarge, measured 2026-08-03), on a named box, at a stated concurrency, and 158 at p99 when the body is big and the protocols differ. Both are true. We publish both.
Read it on your own traffic
None of this asks you to trust the post. Turn on the Server-Timing header and you get Busbar’s own added latency on every response, in your environment, on your hardware, under your load. The /metrics and /stats endpoints expose the rest. The benchmark method is in the repo. If our numbers don’t reproduce for you, that’s a bug we want to hear about, the same way we’d want to hear about a wrong status code.
Performance claims age badly when they’re marketing. They age well when they’re instrumentation you can re-run. We chose the second kind on purpose, and we intend to keep every number on this site honest enough that you never have to take our word for it.
- Matthew
Comments
Comments live in GitHub Discussions, so the conversation stays next to the code.
Join the discussion on GitHub